Graphs and Metrics
Inspector's graphs show how a call changed over time. Start with the summary graphs for a view of the whole meeting, or select participants to compare the media they sent and received. Use the Events Timeline to see connection events and periods of reduced quality.
This page covers the graphs in the public beta. For help finding a call and identifying its participants, start with the Inspector Guide.
Summary Graphs
Select Aggregated in the sidebar to see three summary graphs:
- Connection summary shows attempts to connect and the number of active connections over time.
- Publishers summary shows publishing attempts and active publishers.
- Subscribers summary shows subscription attempts and active subscribers.
Each panel shows totals for attempts and outcomes: Success, Failures, and sometimes Without answer. Use the range slider to take a closer look at part of the call, then hover over a point for its details.
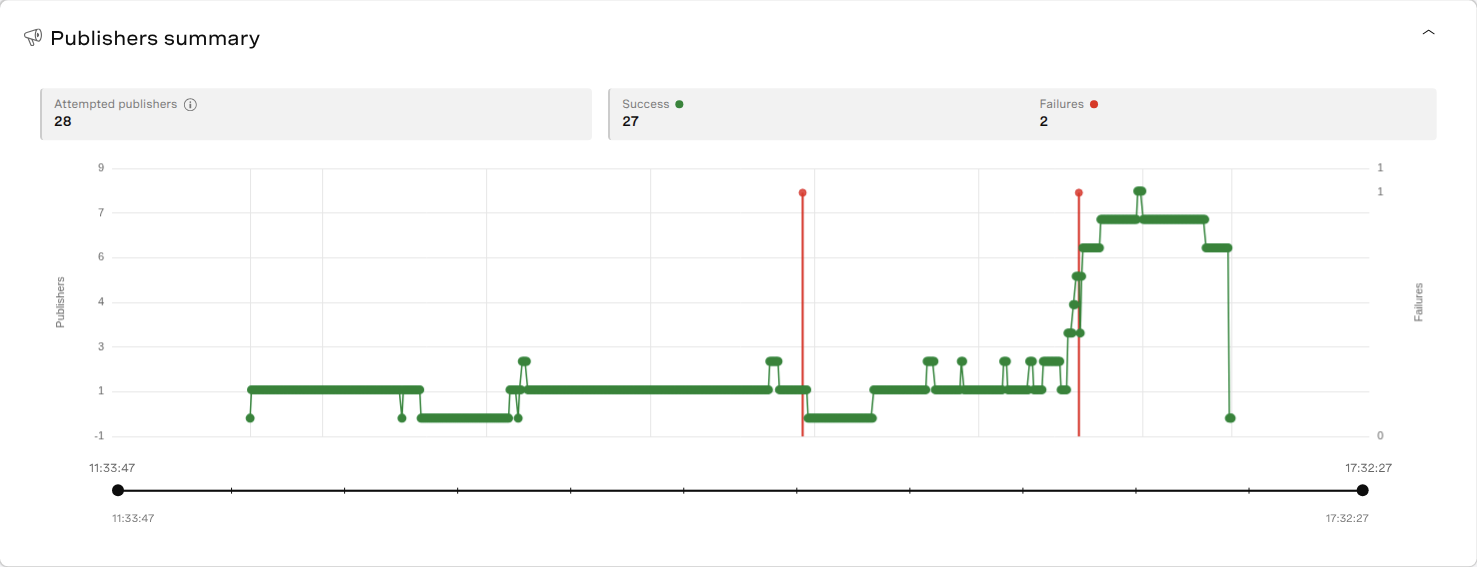
One participant can publish both camera video and a screen share, or subscribe to several other participants, so the publisher and subscriber counts can exceed the user count.
Quality Metrics
Choose Per User and select up to four users in the sidebar. Open Quality Metrics to see bitrate, packet loss, MOS scores, and latency. To compare a publisher with a receiver, select both users.
Choose Media and Streams
Use Stream type to select audio, video, or both. Under Streams, choose Publishers (Senders) for outgoing media, Subscribers (Receivers) for received media, or All users to show both together. The available filters vary by graph; MOS scores come from receiver measurements.
The colors identify streams. Hover over a line to see the user, stream, time, and measurements. Bitrate tooltips can also include codec, resolution, and frame rate.
Focus on a Time Range
All quality graphs share the same time range. Set Start and End, or drag the slider handles, to include some time before and after the problem.
You can also hold Alt on Windows/Linux or Option on macOS while scrolling over a graph to zoom, then drag to move through the range. Reset to Full Session restores the full range.
Hover over a graph to see its values. A vertical line marks the same time on the other quality graphs, so you can compare bitrate, packet loss, MOS, and latency.
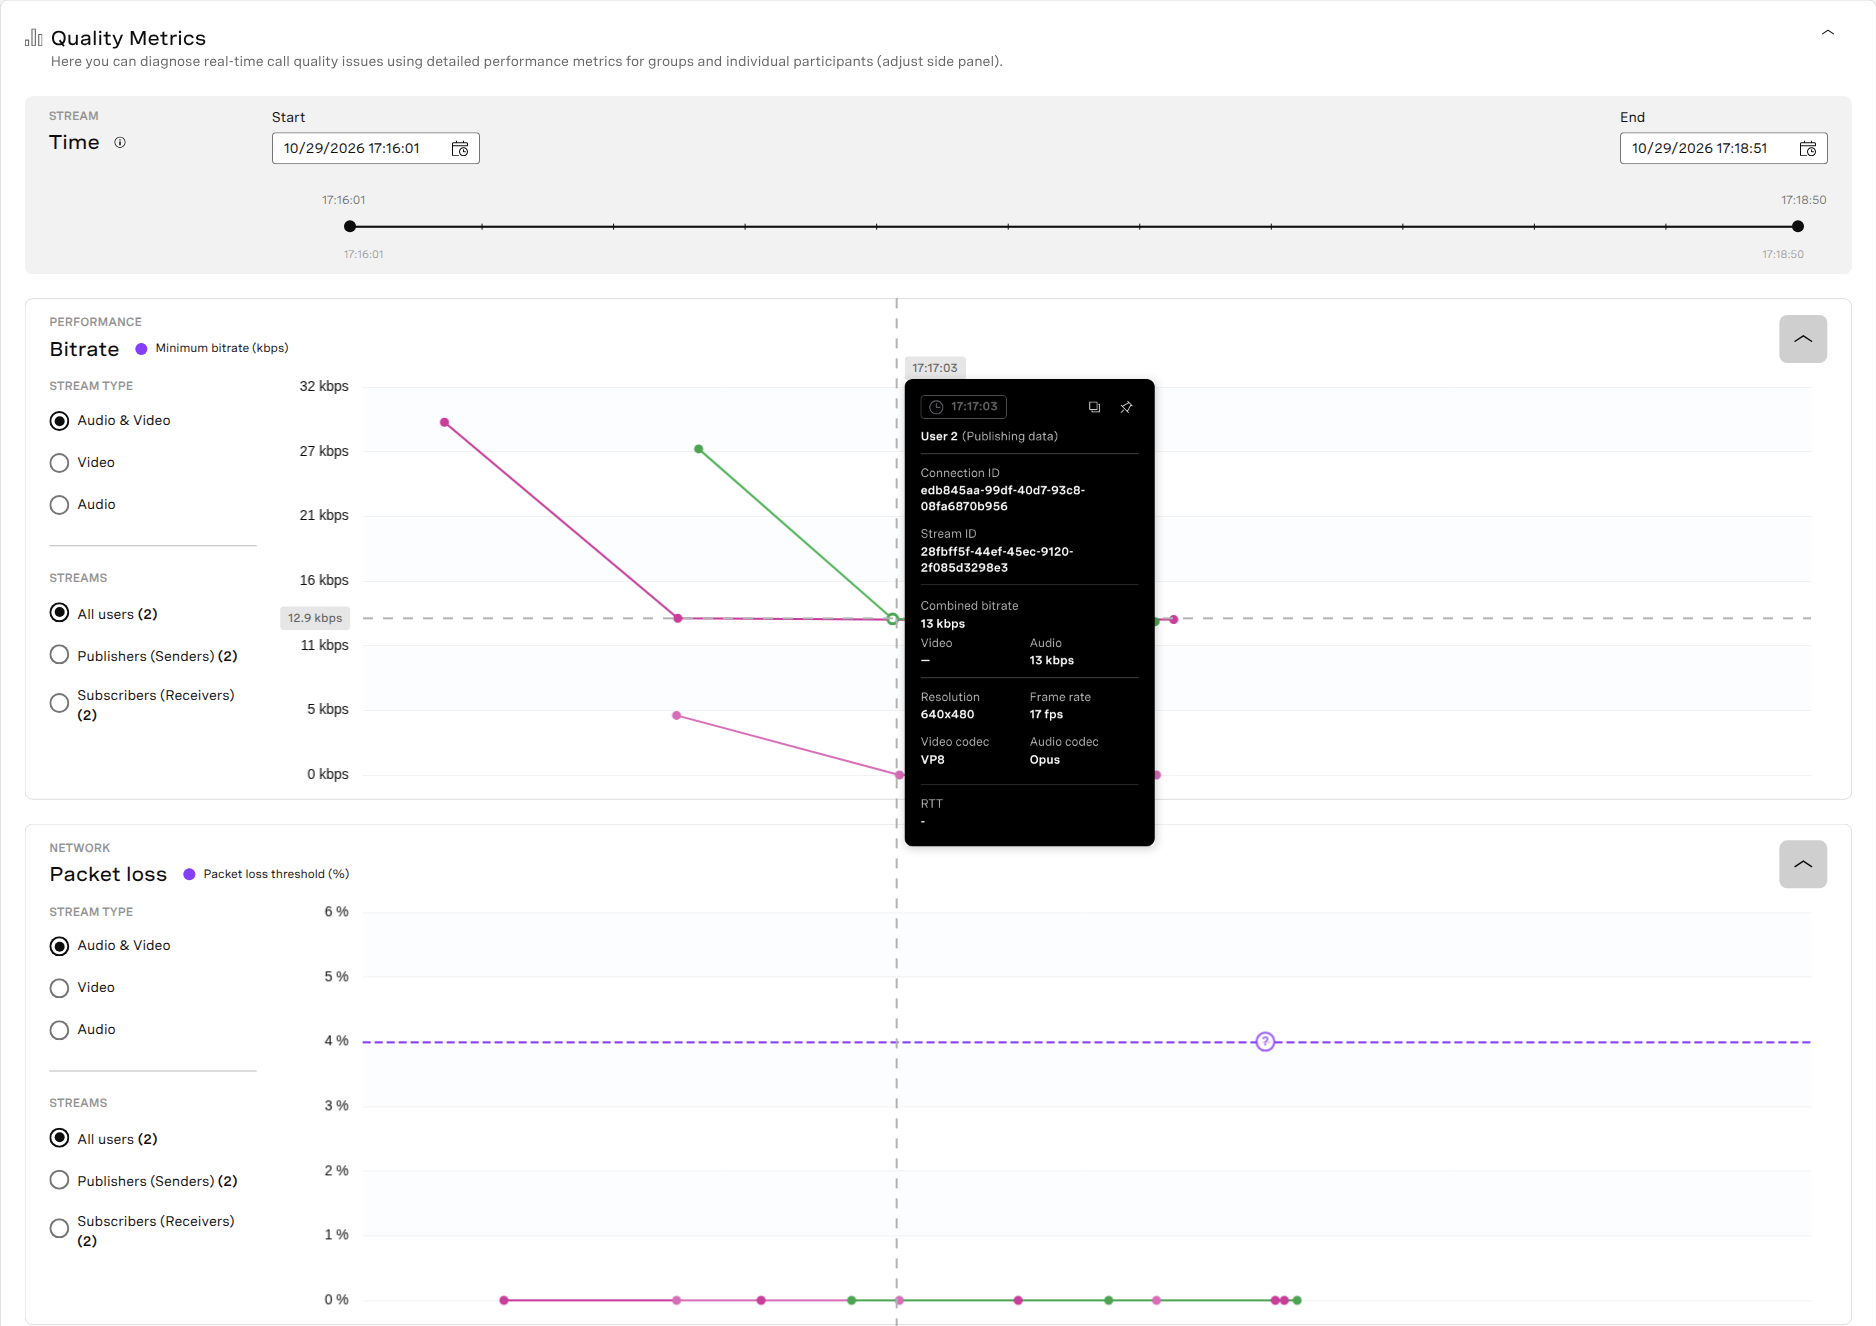
Here, User 2's bitrate tooltip is open at 17:17:03. The vertical line continues through the packet loss graph.
Read the Measurements
Bitrate is the rate of media data sent or received, in kilobits per second (kbps). When the bitrate changes, check the stream's resolution and frame rate as well as what was being sent. With simulcast, subscribers can receive different video layers from the same publisher, so their bitrate and resolution may differ.
Packet Loss is the percentage of packets reported lost. For example, losing one packet out of 100 gives a packet loss of 1%. Compare receivers of the same stream to see whether the loss affected one participant or several.
MOS Score estimates the quality of received audio or video. Audio and video can have different scores. If a score drops, check packet loss, bitrate, and timeline events around the same time.
Latency shows round-trip time (RTT), in milliseconds: how long a packet takes to reach the other end of a connection and return. The delay a participant experiences also includes capture, encoding, playback, and other processing.
Some graphs have a dashed threshold line. Hover over its marker to read the value and explanation. For details about thresholds and units, see the quality metrics reference.
Events Timeline
In Per User, open Events Timeline and expand a user's rows. The Connection row shows when they connected and disconnected. Publisher rows show outgoing media, and the Subscriber rows beneath a publisher show the users receiving that stream.
Use the timeline's time controls to look at the same period as the quality graphs. Collapse rows you don't need.
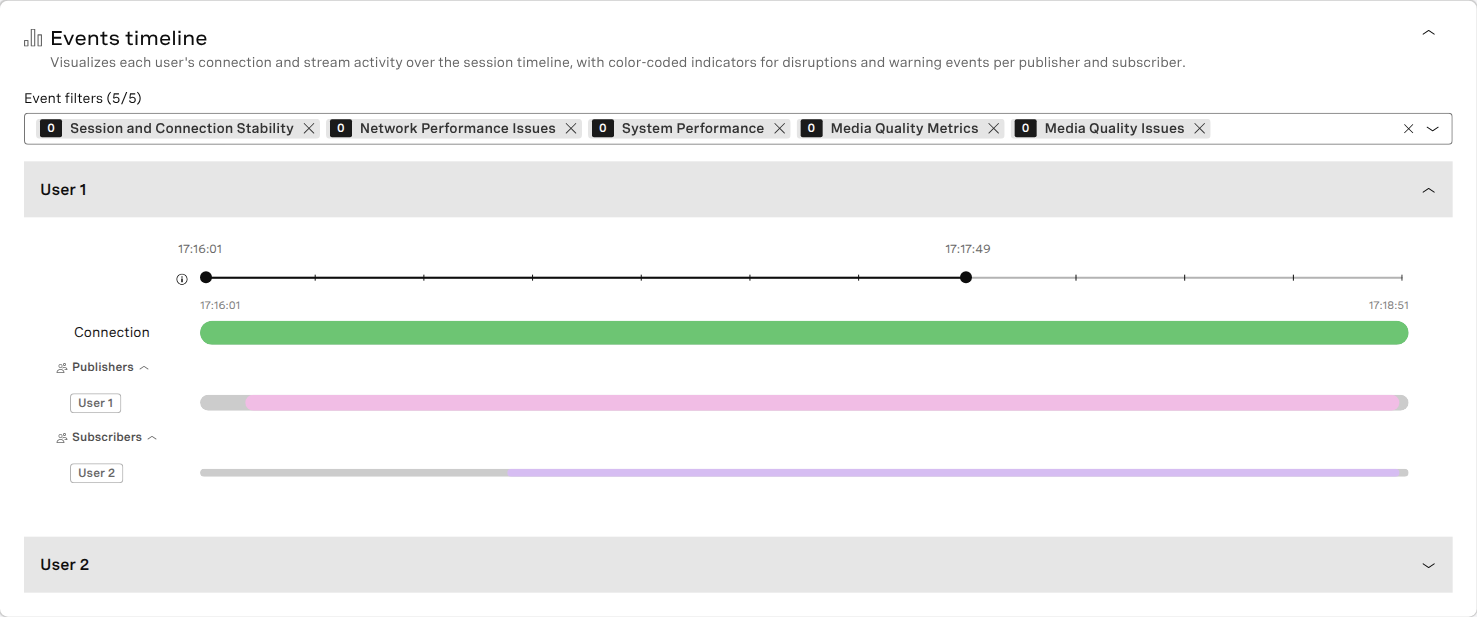
This example shows User 1 publishing a stream and User 2 receiving it. Expanding User 2's own timeline would show that user's connection and outgoing streams.
Read an Entry
Hover over a connection or media activity line for its IDs and timing. Hover over an event marker or highlighted interval to see what happened:
- An Instant entry marks a point in time.
- A Duration entry shows the start, end, and length of an event or condition.
The tooltip shows the outcome and any measurements. Some tooltips group several events or intervals; expand the list to see when each occurred. Select Pin to keep a tooltip open while comparing entries, or Copy to copy its contents to your notes.
Filter the Timeline
Use Event filters to choose the categories to display. For example, Session and Connection Stability includes reconnection and ICE-restart activity, while Media Quality Issues includes video freezes, pauses, and audio fallback. The timeline reference lists all five categories and their entries.
Inspector also uses quality measurements to identify conditions such as low bitrate or bandwidth limitations. These can appear on the timeline without a matching Event Log record.
The publisher statistics and subscriber statistics guides explain the client measurements used by the timeline.
SIP Interconnect
For calls with SIP data, open SIP Interconnect Quality Metrics to see bitrate, packet loss, MOS, and latency. Find the connection in the SIP user details, then hover over its graph to read the measurements.
Choose audio, video, or both on graphs with a media filter. The SIP graphs have their own time controls and share a vertical time marker. Set the same time range in any other panel you're comparing.
Live Captions
When captions data is available, the Live caption panel shows caption activity for the session, publishers, and subscribers. The totals above the timeline count publishers and subscribers with captions enabled.
Expand Publishers or Subscribers to see each participant's activity. Hover over an interval for its start, end, and duration. The tooltip also shows the language when it's available. You can pin a tooltip or copy its details.
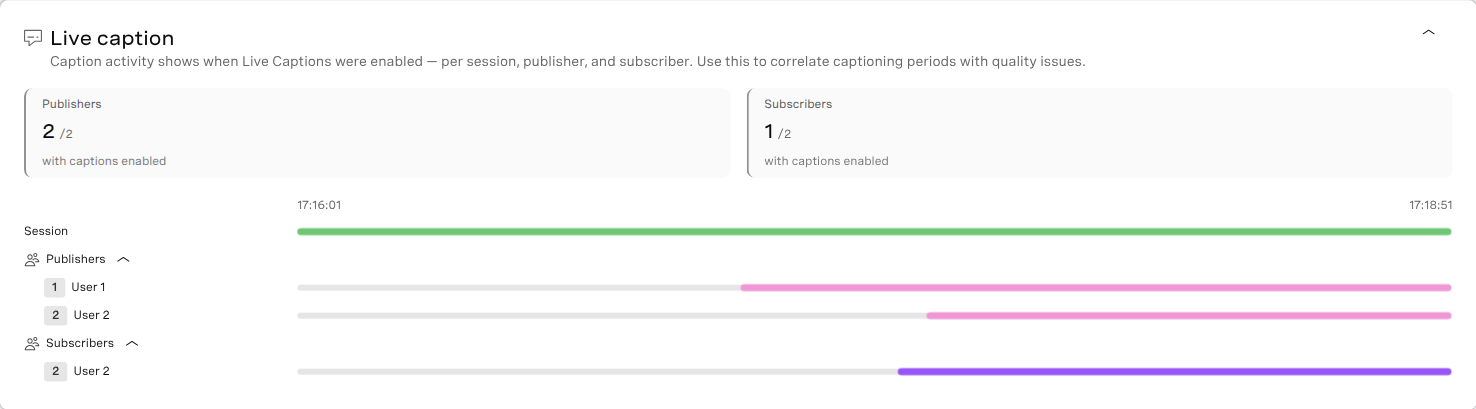
Both publishers had captions enabled during this call, and so did User 2 as a subscriber.
If a graph or panel is empty, see When Information Is Missing.