Session Inspector Overview
Use Video Inspector to troubleshoot your Video API calls. Look up a session to review its participants, connection events, errors, and media quality. The graphs and timeline help you see when a problem started and whether it affected one user or several. You can compare what a user sent with what others received, then check the event logs for connection failures or interruptions around the same time.
This guide covers the public beta of the redesigned Inspector. During the beta, both interfaces remain available. The previous interface is covered by the existing Inspector guide.
Before You Start
You'll need:
- An account with access to the Video API application that created the session.
- The Session ID, or the Application ID and approximate call time.
- For troubleshooting, the time and time zone of the problem and the participant who experienced it. Connection and stream IDs from your application logs can help you find their data.
Find a Session
Open Video Inspector and sign in with the account associated with your Video application.
Search by an Identifier
Enter the Session ID in the main search. You can also enter an Issue ID returned when your application reports an issue through the Video SDK.
Logging session IDs in your application makes it easier to find a call later.
Session data is available for 20 days and usually takes about five minutes to appear. If you reuse a Session ID, lookup results cover up to seven dates. See data limits for details.
Find a Call in Meetings List
When you do not have the session ID, use Meetings list:
- Set Time Range to cover the call. Include some time on either side if the reported start time is approximate.
- Narrow the results to the relevant Application ID.
- Compare the start time, duration, user count, and media mode with the call you are looking for. Sorting the columns can help locate it.
- Open the session ID in the matching row.
For a long list of results, use In progress to show sessions marked as ongoing or Errors (>3) for sessions with at least four recorded errors. See the filter reference for the full list of controls.
Saved sessions have names and tags in the Saved column to help you recognize them.
Select the Meeting and View
Think of a session as a room: an application can use the same room for several calls. If it reuses the session ID for a morning call and another in the afternoon, Inspector can show them as separate meetings under Session range. Choose the meeting whose start time and duration match the call you're looking for.
Set the time zone in the sidebar to match the reported call time.
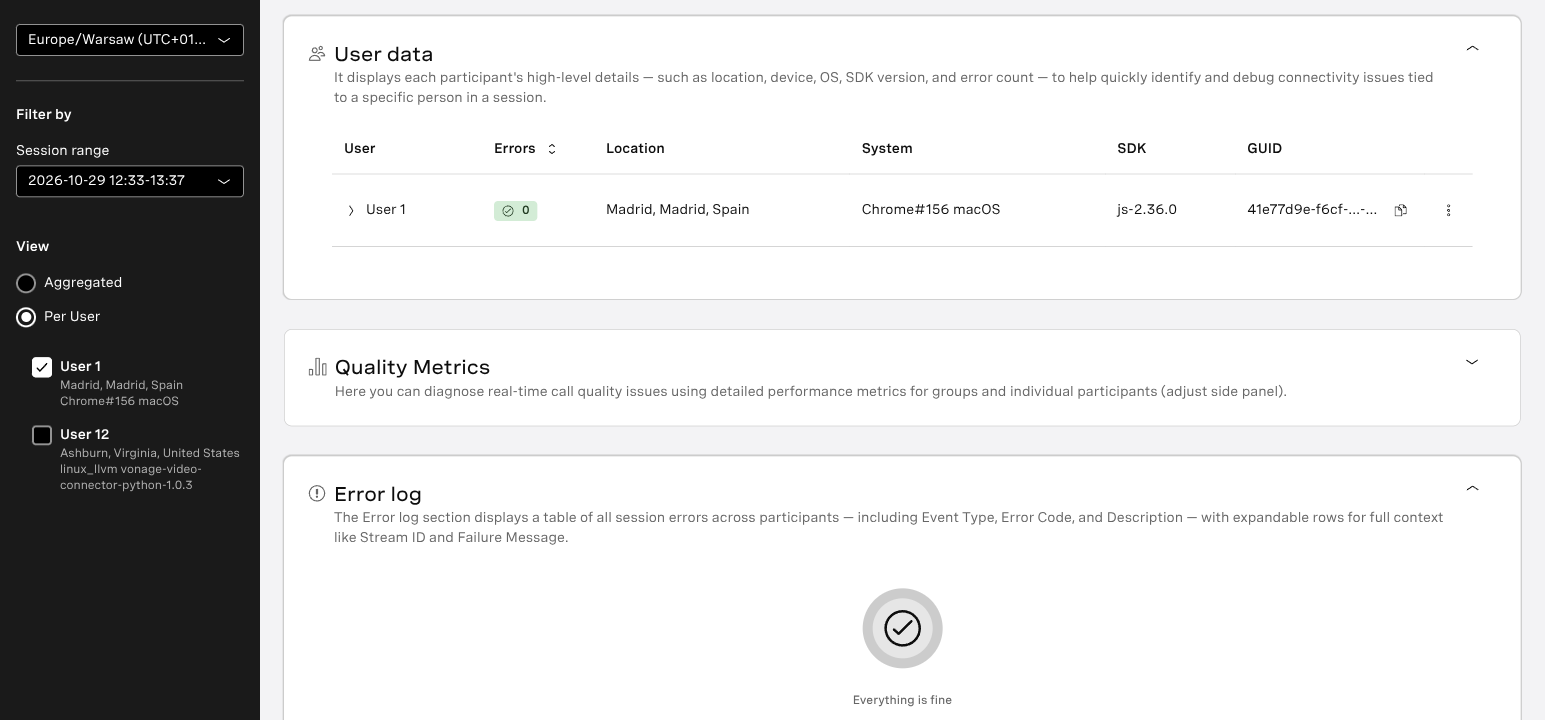
The sidebar offers two views:
- Aggregated shows summary graphs for connections, publishers, and subscribers. It's a useful starting point for a busy meeting.
- Per User lets you compare quality metrics and Events Timeline for up to four users at a time.
If one participant couldn't hear another, select both the receiver and the publisher of that audio. You can add other receivers to check whether they experienced the same problem.
The participants you select in the sidebar determine whose data appears in the graphs, timeline, and logs. The summary counts still include all participants in the session.
Read the Summary
Meeting summary shows the session and application IDs, timing, saved-session information, and features used in the call. An ON indicator means the feature was used during the call. Some indicators link to a panel with more details.
Meeting statistics lists the call type, media mode, and counts of users, connections, and streams. Total streamed minutes combines published and subscribed media time; its tooltip shows the breakdown. Accounts with the Advanced Insights add-on also see Total participant minutes.
| Term | Meaning | Example |
|---|---|---|
| User | A client application, such as a participant's browser or mobile app, shown in Inspector. | User 1 |
| Connection | A client's connection to a session, identified by a connection ID. | Connection A |
| Publisher | Audio or video a client publishes to the session. | Stream A |
| Subscriber | A client's reception of a published stream. | User 2 subscribes to Stream A |
For example, someone can publish their camera and a screen share while receiving video from two other participants. That's one user with two published streams and two subscriptions. If they disconnect and rejoin, Inspector may list a second connection under the same user. For more on these concepts, see Video API Basics.
Inspect Participants
Open User data to see each user's SDK, system, location, and GUID. Use your application logs to match an Inspector user to a participant.
Select a user row to expand its connections and streams. Find the connection active when the problem occurred, then open its details to see the end reason and publishing or subscribing activity. For screen-sharing issues, select the participant's screen stream.
You can copy individual identifiers using the controls beside them. To copy the user's details together, open User details overview from the actions menu and select Copy information. Selecting an error count takes you to that user's entries in Error Log.
Each stream has measurements from its publisher and subscribers, so you can compare what was sent with what each participant received.
Explore Call Quality
Switch to Per User to see Quality Metrics. Inspector provides four graphs:
| Graph | What to look at |
|---|---|
| Bitrate | Media data sent or received, measured in kilobits per second (kbps). The tooltip can also include codec, resolution, and frame rate. |
| Packet Loss | Percentage of packets lost for the selected stream. |
| MOS Score | Estimated audio or video quality reported for receivers. |
| Latency | Round-trip time (RTT): how long a packet takes to reach the other end of a connection and return, in milliseconds. |
Audio and video travel in small units called packets. If 100 packets are sent and only 99 arrive, the Packet Loss is 1%.
Choose audio or video, then select the publisher and receivers you want to compare. Filters vary by graph; MOS scores are available only for subscribers.
Use Start and End under Time, or the range slider, to focus on the period around the problem. Hover over a graph to read the values at a particular time; a vertical line marks the same time across the quality graphs.
For examples and help using the controls, see Graphs and Metrics.
Explore the Event Timeline
In Per User, open Events Timeline to see what happened around the same time. Expand the user's rows to follow their connection and streams.
There are three types of row:
| Row | Activity |
|---|---|
| Connection | When the user connected and disconnected, with client and network details. |
| Publisher | Outgoing media, such as camera video or screen sharing. |
| Subscriber | Users receiving this publisher's streams, with a separate row for each receiver. |
Hover over an activity line to see its identifiers, source, and timing. Events and highlighted intervals have their own tooltips with details of what happened.
Use Event filters to choose categories such as Session and Connection Stability or Media Quality Issues. You can pin a tooltip to keep it open while comparing entries.
See Events Timeline for an example and an explanation of the controls. The timeline reference lists the events and measurements.
Check Errors and Event Records
Error Log lists failures with their code, description, time, and user details. In Per User, it shows errors for the selected users. For audio or video quality problems, check Quality Metrics as well.
Event Log shows the sequence of individual client and server events. Expand a record to inspect its payload and use the filters to narrow the results:
- Keyword finds terms in event details.
- Severity distinguishes informational records, warnings, and errors.
- Status distinguishes an attempt, success, or failure.
- Client and Server let you examine the source of the records.
After locating a failure, clear the failure filter to see the attempts and successes around it. Include both client and server events to follow the sequence.
To export the records, choose Filtered and Download. All data includes records excluded by the Event Log filters. Both options export data for the selected meeting and users. The Event Log reference explains keyword matching and the export format.
Inspect Other Session Features
Depending on the features used in the call, Inspector can also show:
- SIP Interconnect — SIP user details and dedicated quality graphs.
- Live Captions — a captions timeline for publishers and subscribers, with language information when recorded.
- Interactive Broadcast — broadcast identifiers, type, status, resolution, and timing. Select a broadcast to see its details.
- Recording (Archiving) — recording activity, with diagnostics in Archive Inspector.
The summary also has indicators for Post Call Transcription and Allowed IP list.
Save Data and Return Later
Save the session before its data expires if you need to return to it later. Choose the save action in Meetings list or Save session in the session summary, then enter a name and optional tags.
You can reopen it from Meetings list, where its name and tags appear in the Saved column. Save a Session covers permissions, limits, and the steps to reopen or remove a saved entry.
When Information Is Missing
If a panel or graph is empty or incomplete:
- Verify the selection: Make sure you have opened the correct account, session, and meeting.
- Check the view: Switch to Per User for individual quality graphs and the Events Timeline, then select the relevant users.
- Review filters and time range: Check the media type, stream filters, visible time range, and timeline event categories.
- Check data availability: Confirm that the underlying source data is available and that you are not viewing an older saved snapshot with limited data.
- Review data limits: See data limits for session history, missing timeline events in older saved sessions, and the limit on comparing users in large sessions.
An empty panel does not necessarily mean that no events occurred. The information may be unavailable, outside the selected time range, excluded by filters, or unsupported by the selected view.
More Inspector Guides
| To… | See |
|---|---|
| Read the graphs and use their controls | Graphs and Metrics |
| Keep diagnostic data for later review | Save a Session |
| Look up a metric, filter, event, or data limitation | Inspector Reference |
The Insights API provides programmatic access to session analytics. For diagnostics collected directly in your application, see Client Observability.
Share Findings or Send Feedback
When sharing your findings, include the session, connection, and stream IDs, the time of the problem with its time zone, and any graphs or event records that show it.
To report a problem with Inspector, select Feedback on the session page. Describe what happened and what you expected, attach any useful screenshots, and select Send feedback. The form includes session context automatically. For help with your application or a service issue, contact Vonage API Support.